Under Construction

This page is under construction. Come back in a week or 2.
There will be information about Robinhood, Wealthsimple trade & Questrade.
Disclaimer about day trading

 This page is about day trading the stock market. It will start very simply with the basic education you may need.
However, please realize that I am not a professional trader. I do not pretend to guarantee anything. You may make money  or you may lose money by following my system.
The points I make below are what I’ve picked up over the years. I’m now going to pretend to buy with a dummy account. If I make a decent amount of make-believe money, I will start day trading real money and discuss my trades at the bottom of this page.
I do not recommend that you read this entire web page in its entirety. There are too many facts.
Rather, I recommend that you look through the index below. Find a topic that interests you. As you delve more deeply into the concept of day trading, look up related topics in the index.
Page Index
- Bear vs bull market
- Charts for American stock exchanges
- Exponential moving averages, 8 & 34 day EMAs
- Formula, when to buy and sell
- Institutional investors
- Limit order, what is it?
- Practice trades before I start buying
- Price of stock at WealthSimple
- Resistance, support, channels, etc.
Basic information about day trading
Bear vs. bull market
The bear and the bull are symbols related to the stock market. Think of a bull throwing someone up with his horns. When the market prices are rising, that is a bull market.
Think of a bear knocking someone down with his paw.When the market prices are falling, that is a bear market.
If the market is a bear market, don’t trade like a bull and vice-versa.
2 important day trading factors
-
- Education. Don’t start day trading until you have enough basic education. Learn how to read candle charts. Practice with pretend money before starting with real money.
- Fear & greed. Don’t let fear & greed sidetrack you. They are two of the main emotions moving the stock market.
Decide upon your rules telling you when to buy or sell. Then live by those rules. Don’t let fear sidetrack you from those rules. Don’t let greed interfere with following your rules. Just keep going ahead as if the money did not matter.
Limit order
A limit order is an order to buy or sell a stock with a restriction on the maximum price to be paid or the minimum price to be received (the “limit price”). If the order is filled, it will only be at the specified limit price or better. However, there is no assurance of execution.
Buy low, sell high
 Further down this page you will learn how to find a number of charts. You will draw support & resistance lines.
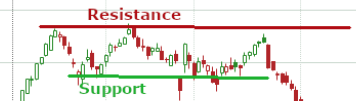
Support line represents the lowest point the price drops to during a rally. The resistance line represent the highest point the price rises to during a rally. “Buy low, sell high” implies that you should buy near the support line and sell near the resistance line.
To draw your resistance line, find 2 or preferably 3 points that have similar price points before going down to the bottom again. Draw a horizontal line representing the resistance.
To draw your support line, find 2 or preferably 3 points that have similar price points before going up to the top again. Draw a horizontal line representing the support.
(To help you remember that the support line is on the bottom, think of walking through your house. The ceiling does not support your weight; the floor does.)
By drawing the support & resistance lines and following the rules, you will not be tempted to get onto some bandwagon and buy some thing just because it’s “hot”.
The formula above can be permanently inserted into a spreadsheet. Then you can look at the support and resistance lines and make sure there is a minimum price difference of 1.5%. That would make this a good day trade if you followed the rules of “buy low, sell high”.
Candle charts
Possibly the most useful charts you will see are the candle charts. They 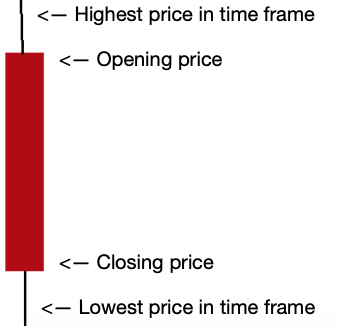
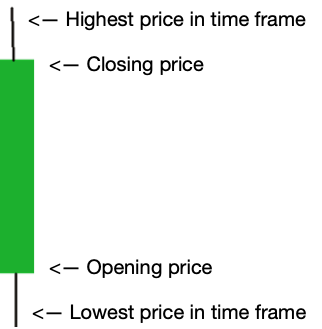 represent the highest & lowest and opening and closing price in a time frame. The time frame could be minute, 5 minute, half hour, day or or any of a number of different time frames.
The ends of the candle bodies represent the opening & closing price in the time frame. The wicks of the candles represent the highest & lowest price in the time frame.
For instance, I have a trading account with the TD bank here in Canada. I went to their trading section and clicked on Research > Tools > Charts. I found the one-day chart below for Element 79 Gold Corp (ELEM). (ELEM represents the unique abbreviation for Element79 Gold Corp.)
Below is an animated GIF for finding different candle periods. The 2 lines represent the exponential moving averages (EMAs)and are discussed below.
Resistance, support, channels, etc.
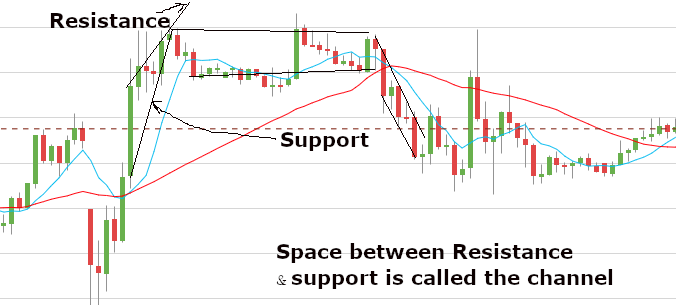 Connect 2 & preferably 3 candle tops. That is called the resistance line because the price does not want to go above it. Connect 2 & preferably 3 candle bottoms. That is called the support line because the price does not want to go below it.
The space between the resistance and support lines is called the channel. You want to buy near the bottom of the channel and sell near the top. I.e., buy low and sell high.
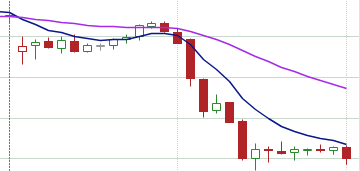
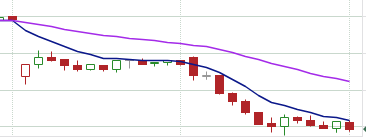
In the diagram the channel on the left represents an uptrend. That is followed by a sideways trend and then by a downtrend. Actually, it would be better to use the first set of very short candles as a sideways trend and the second set of very short candles as a downtrend. In a sideways channel the highs and lows are more or less the same.
The sideways channel is followed by a large green channel and a major downtrend.
Note the red and blue lines. These are the 34 day and 8 day exponential moving averages (EMAs). Do not buy at this time. This is when the institutional buys have traded in large quantities. The market is too hard to predict at this time.
Institutional investors
Every once in a while institutional investors such as pension funds will jump in and buy many millions of dollars worth of stock at more or less the same time. Unless you can figure out when they are doing that, your system of predicting trends will not work.
There is a way of finding when the institutional investors are buying and therefore starting a new trend. Look at the 8 day and 34 day exponential moving averages (EMAs) on a 30 minute chart. When the 2 lines cross, the institutional investors are jumping in. Do not invest at such a time.
 In this example, I plugged in the symbols of the best selling Canadian stocks on the TSE. I used the TD bank investing platform. Notice when the two lines were crossing. Of these 7 stocks, 5 of them were being bought by institutional buyers on June 22. Two were being bought on June 21. You would not buy those particular stocks on the given date.
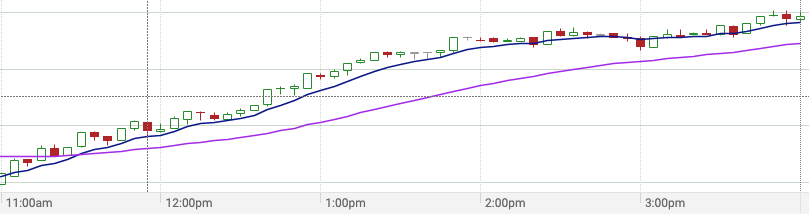
On the chart above, the magenta line is the 34 day EMA and the darker line is the 8 day EMA. On the 30 minute chart they crossed a little after 11 am. On the 5 minute chart they crossed between 11 am and noon. There was an uptrend until 2 pm. Then, between 2 and 4 pm there were 11 red candles and only 13 green candles.
The 2 to 4 pm change shows me that the trend is slowing down. There is not enough information for me to make a buying decision.
After the institutional investors
I checked all of the big 5 Canadian banks 2 days after the institutional investors. They were all similar to the chart above. Around a day after the institutional investors bought, there was a huge drop in price. Then the price levelled off. The chart above is from the TD bank.
(A free source of stock charts, etc. for the American exchanges can be found at finviz.com.)
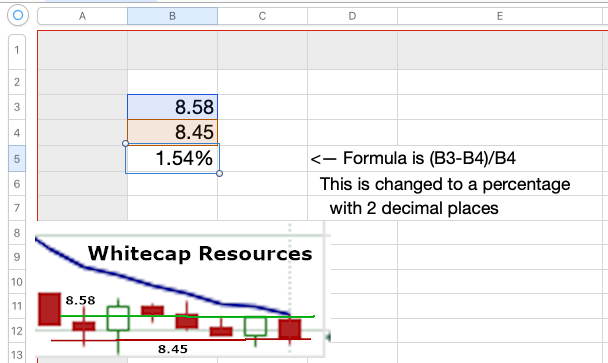
These are the resistance and support lines for the chart above. Notice how the prices from those lines were inserted into the spreadsheet formula.
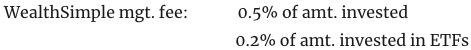
When I trade with WealthSimple, they charge a 0.5% management fee for each trade. That means if I buy & then sell to make a profit, I am charged a total management fee of 1%. In order to make a profit, I want to have support-resistance spread of at least 1.5%.
Here the formula that is always in my spreadsheet gave me a spread of 0.38%. So, at this time, I would not day trade TD.
However, look at this animated GIF above for Whitecap Resources. The resistance line was 8.58 and the support was 8.45. When I filled those numbers into the spreadsheet, it gave me a profit before commissions amount of 1.54%. So, I would consider that a good stock to day trade at the moment.
ETFs (exchange trading funds)
ETFs are baskets of securities that trade on an exchange just like a stock does. ETF share prices fluctuate all day as the ETF is bought and sold.
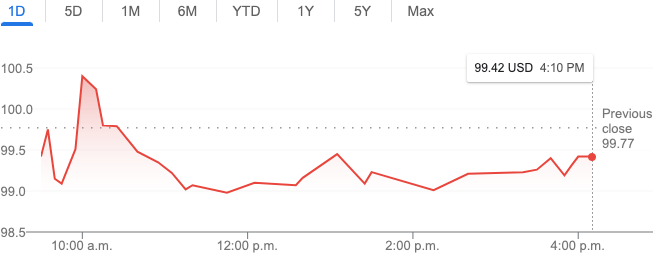
The first EFT ever was the SPDR (pronounced “spider” and has the stock symbol SPY). It tracks the Standard & Poor 500. Make a Google search for this: spdr s&p 500 etf (spy). Below the advertising you will find the trading information below.
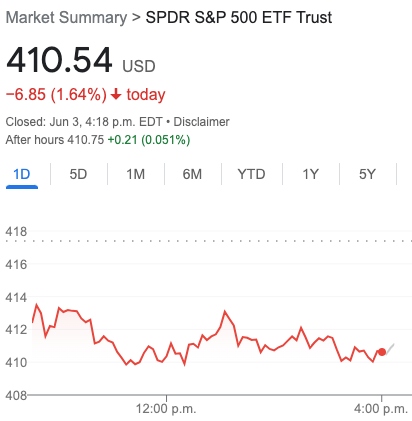
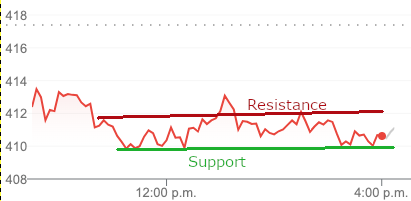 If I were drawing support and resistance lines for SPY, they would look something like what you see here. When day trading it, I would try to buy around $410 and sell when it got up to $412.
However, that probably isn’t even enough to pay the broker’s management fee. So, in order to day trade in SPY, I would have to use candles of a different time frame and then draw new support & resistance lines. Perhaps I could have a reasonable chance of making a decent amount of money.
Another ETF worth searching out is REMX.
To help you find ETFs in a variety of industries, go to ETFDB.com.
Because I strongly believe in the principle of diversification, I would not pay $410 for any share. (I’m not rich.) So, I would go to a company like WealthSimple and buy a fraction of a share and pay much less than $410.
Wealthsimple Trade
Wealthsimple Trade is an online brokerage service for Canadian, American and UK accounts. It allows you to buy and sell thousands of stocks and ETFs on popular Canada and U.S. exchanges without paying a fee*. (* However, notice the management fee in the next paragraph.)
They make their money by charging a 1.5% fee for buying USD. (Many stocks you may want are available only on American exchanges.) They also charge a management fee of 0.5% of the money you have invested. (Drops to 0.4% if you invested over $100,000.)
However, if you want to do lots of trading in USD, those exchange fees can add up. So, Wealthsimple has another feature called Plus. For $10 a month, you can buy and sell all the U.S. stocks you want — with no commission charges and no foreign-exchange fees on trades.
You pay foreign-exchange fees once. That’s when you spend your CAD to buy USD to set up you USD account. You use that account to buy American stocks on American exchanges.
Get the app
I read in one of the reviews that, as of the time the article was written, the WealthSimple app works much better on a smartphone than on a desktop or laptop. So, download the app into your smartphone now. Start buying Canadian & American stocks & ETFs now.
Set and forget
When you study the WealthSimple website, you will most likely read about robo-advisors. These are low-cost, online investing platforms that employ software algorithms to create and manage investment portfolios. The ongoing day-to-day management of the portfolios is handled by computers.
Please note that this is NOT day trading.
Pros & Cons of WealthSimple
Pros
- Quick & easy setup.
- No minimum deposit.
- Dividend reinvesting the day after it is received.
- Simple & easy-to-use app for your smartphone.
Cons
- Robo-advisor does not offer as wide a range of products as other companies.
- Investors are restricted to ETFs and stocks that are listed on the NYSE, NASDAQ, TSX or TSX-V exchanges.
- Stocks must be priced at a minimum of $0.50 per share and trade an average of at least 50,000 shares daily.
- If an asset is a dual-listed security, meaning it’s on both a U.S. and a Canadian exchange, only the Canadian-listed asset is available.
- Do not support stop-loss orders.
- Research on stocks & ETFs is very limited.
- Market data is time delayed. To get it in real time, you have to pay $10 monthly for the Plus account.
- They have no charts of less than one day. So, to see 5-minute, half-hour, one-hour, etc. candles, you have to set up a second account with another broker.
- Not able to zoom into the charts.-
- Does not supply headlines and company news to help you make buying decisions.
Stop-loss orders
One downside of Wealthsimple Trade is the fact that, as of this writing, they do not support stop-loss orders.
Trends eventually end. Suppose you buy a stock for $100 and you are hoping it will go up. However, the trend has ended and the price begins to drop. A wise day trader would get out of the trade when it had dropped 8%. That would be $92 in this case.
Some brokerage firms allow you to automatically sell when the price drops to a certain point. That is called a stop-loss order. Wealthsimple does not offer that. You have to watch the prices yourself.
Account types & geographical area
Wealthsimple’s account types vary according to your geographical area. In the United States, they provide support for individual and joint taxable accounts, trust accounts and a range of retirement accounts.
In Canada, Wealthsimple offers tax-free savings accounts (TFSA), corporate accounts, joint accounts, retirement savings plans (RSP), locked-in retirement accounts (LIRA), registered retirement income funds (RRIF), registered education savings plans (RESP) and taxable accounts.
In the U K, Wealthsimple offers pension accounts, individual savings accounts (ISA), junior individual savings accounts (JISA) and personal taxable accounts.
Questions?
If you have question about WealthSimple, try going to help.wealthsimple.com. Use the search box first to see if there is information about your question.
 If that does not answer your question, scroll down and click the yellow Contact Us button. You can chat with a human.
Q. If I buy or sell at market price, is that done in real time?
A. Yes, it is in real time. While the price you see in the app is the most recent traded price, this is meant to help you estimate the price point the security is trading at.
All orders will fill on the best bid and ask prices available at the time of your order, these are the best prices a buyer is willing to pay for your stock or the best prices a seller is willing to offer you for a stock!
You could view the current bid and ask price of a stock before placing your order! It would be a small information icon next to the market price!
For more related information, go to this order price article.
Links about Wealthsimple
Practice before you buy
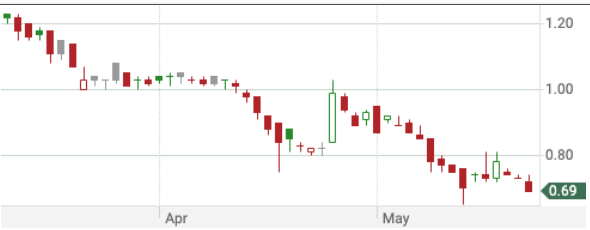
 See this chart of the activity of Whitecap Resources after the institutional investors traded millions of dollars worth of the stock. A day after they traded, there was a huge drop in price for half a day. Then it levelled off for the rest of the day.
Because WealthSimple seems to be the best solution in Canada for day trading, I’m going to make a number of make-believe trades to see how much money I could reasonable make in a month. In this example, I will assume that I start with $600 (CAD) and use WealthSimple for all of my trades.
I expect to start day trading on the TSX. For that I will be charged a management fee of 0.5% of the amount invested. After a few days I’ll be investigating the possibility of day trading in ETFs.
Expenses
First practice trade: Whitecap Resources
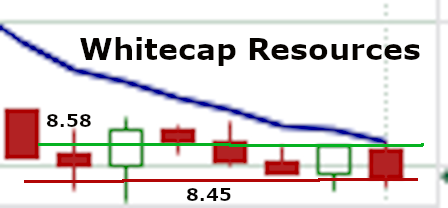
If you click on the link above, you will go to a section on this page that shows the formula on the spreadsheet. It produced a support-resistance spread of 1.58%. Because that is greater than 1.5%, I will make a make-believe buy limit order of $8.45. Then I will try to sell when it gets up to $8.58.
Thursday late afternoon
It is now the end of the day. I just made a make-believe order of approx. $200 worth of Whitecap Resources at $8.45. I will wait until tomorrow to see whether or not I can make a sale at $8.58.
Next day
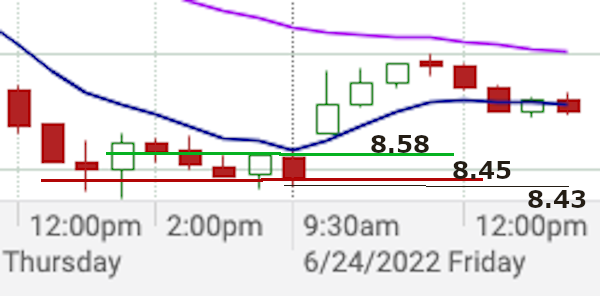 On Thursday afternoon I placed a limit buy order for $8.45. The price went down to $8.43 and then went up again. (Keeping my rule of not letting the trade go more than 8% in the wrong direction, I could hang on to my trade. It would have gone down to $7.77 before it was down 8%.)
So, I would have been able to buy it at $8.45. I would not have ordered more than $200 worth. That would be 23 shares. I rounded it downwards to a multiple of 10.
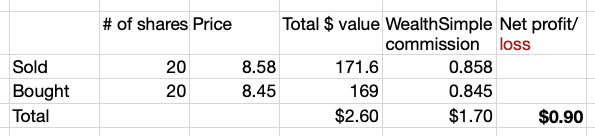
On Friday I would have placed a limit sell order for $8.58. Wherever possible, the spreadsheet below has a formula in a cell to help me quickly find the potential net profit.
As you can see, in this case I would have a net profit of ninety cents. That is sort of silly to go for a trade with such a low net profit. However, now I have a spreadsheet with the formulas in place to help me decide if a trade has a worthwhile potential.